Hidden Capacity on a High-Speed Cookie Line – 215‑Employee Facility in Ontario
Timeline: Q4 2025 – Q1 2026 (6 months from kickoff to stable results)
Executive Summary
- • Problem: Capacity‑constrained cookie plant. More orders than they could fill. OEE at 65.8%.
- • What we did: Ignition MES + low‑cost machine tweaks. No new line.
- • Result: +5.04% OEE → 11.9M more cookies/year → $432k annual benefit → $1.3M 5-year Net Present Value.
- • Payback: 9 months.
- • But night shift only gained 1.7% availability (vs 2.0% on days) because they resisted change for three weeks.
The Problem (before)
Baseline OEE: 65.8%. Considerable invisible losses.
- Changeovers: 90 min to 2.5 hours – no standard process.
- Unplanned stops: bearings, dough jams, belt tracking. No warning.
- Slow running: line rarely hit speed. Not broken, just… slow.
- Overweight cookies: ran heavy to avoid CFIA trouble. 0.2-1g extra × 155M cookies = real money.
- Canadian winter: ingredient temp hit -20°C one morning. Dough cracked. Depositor went crazy.
“I’ve got five SKUs fighting for one line. My guys work hard, but hard work doesn’t show up on the P&L if the machine’s down.”
— Plant manager
What We Did
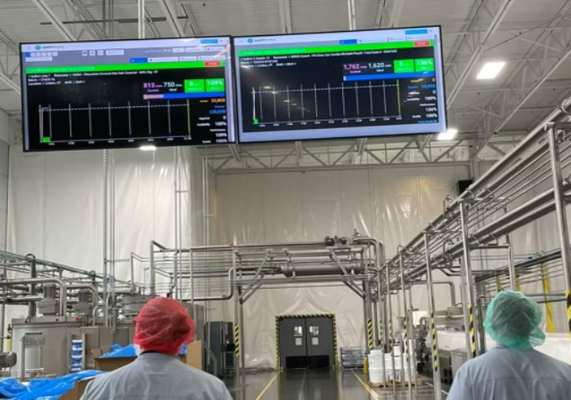
- Line Speed: Built an Ignition MES module with real-time OEE dashboards on the floor and in the office. Operators see slow running and fix it. Consistent target speeds now achievable.
- Real-time alerts (alarms/SMS/email) for downtime (jams, micro-stops, breakdowns), slow running, and bad quality.
- Quality and Waste: integrated quality monitoring and SPC have drastically cut scrap, rework, and defects – better product consistency, less waste.
- Sanitation and changeover times cut: digitized checklists and timers standardized the process.
- Shift and line reports automated – trends, benchmarks, decisions.
- Unplanned Stops: added vibration sensors on bearings plus belt monitoring – early warning before a breakdown.
- Overweight Product: optimized depositor mechanisms and continuous tracking eliminated excess ingredient use, delivering real material cost savings.
Failures that happened:
- First dashboard crashed during shift change. Lost four hours of data. Resolved the root cause at the gateway level.
- Encountered data collection issues with the depositor and wrapper (different integrators/vintages). Resolved via a two-day collaboration between the plant PLC engineer and our team to bridge systems via Ignition.
- Lost 12 hours of production data first month because a $50 network switch died. No backup. Now we keep spares.
Weird anomaly nobody predicted:
Quality dipped for two weeks after go‑live. Operators were staring at the new screens instead of watching the line. Small jams went unnoticed. We added audible alerts – problem fixed.
Vendor finger‑pointing:
Depositor OEM blamed the wrapper OEM. Wrapper OEM blamed about an Ignition data capturing issue. Our engineer proved it was a sensor issue on the depositor’s analog output. Took a week of conference calls.
Union reaction:
Shop steward showed up after three days. “You’re not tracking bathroom breaks, right?” We showed him we only track machine state, not people.
Safety near‑miss:
Week 2, an operator reached past a guard to clear a jam while the line was still creeping. Sensor didn’t see him. We paused the project for a day, re‑trained everyone, and added a zero‑speed sensor on that section.
CFIA – not dramatic:
Auditor showed up unannounced during week 2. Asked about weight control. We pulled the six‑month trend from the new system. He nodded and moved on. That’s normal, not a story.
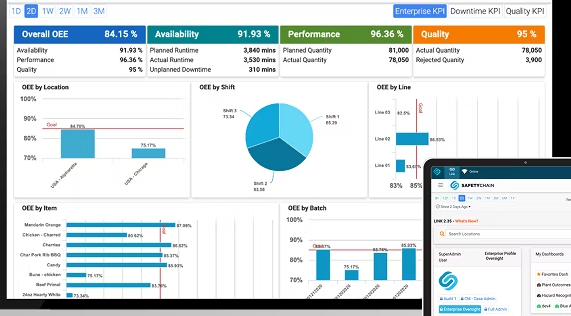
Results (what we gained)
| Metric |
Before |
After |
Change |
| OEE | 65.8% | 70.84% | +5.04% |
| Availability (days) | 84.50% | 86.50% | +2.0% |
| Availability (nights) | 83% | 84.70% | +1.7% |
| Performance | 87% | 89.80% | +2.8% |
| Quality | 89.50% | 91.20% | +1.7% |
- Cookies per year: 167.8M → up 11.9M
- Changeover time: -39% (404 labor hours)
- Unplanned maintenance: -12% (124 hours)
- Minor jams / sanitation stops: -49% (508 hours)
Financials (simple, no finance jargon):
- Profit from extra cookies: $239k
- Labor savings (reallocated to more production – no layoffs): $18k
- Scrap/rework reduction: $68k
- Less overweight cookies (0.2-1g avg cut): $107k
- Total annual benefit: $432k
- 5-year Net Present Value at 10% Discount Rate: $1.3M
- Project cost: $324k
- Payback: 9 months
Energy :
Electricity dropped from 142 kWh per 1,000 cookies to 131 kWh. Oven idling during long changeovers was the biggest culprit.
What almost killed the project
- Operator pushback. One senior guy: “I don’t need a screen to tell me how to run my line.” Three weeks later he was pointing at slow states.
- Management patience. Results took 90 days. At 60 days they were asking questions.
- That dead network switch. Now we have spares.
- Night shift resistance. Their availability gain was only 1.7% (vs 2.0% on days). We had to run extra training at 2am.
Testimonials
“Eleven years on this line. First time I can see where my time goes. Dashboard doesn’t lie and it doesn’t have favorites.”
— Senior operator
“My favorite number is the weight chart. I stopped arguing with nights about who runs heavy. Now we just look.”
— Production supervisor
“CFIA asked about weight control. I pulled the trend. Auditor moved on in five minutes. That never happens.”
— Quality manager
One of the biggest advantages: these insights and visibility naturally drive operators and supervisors to corrective action right on the floor.
About Inveta Automation
We do Ignition, Siemens Opcenter, and AVEVA based Manufacturing-ERP, MOM, MES for food & beverages in Canada and the USA. We’ve been on the floor – we know what a flour‑dusted panel looks like.